What is Data Enrichment?
Data enrichment is the process of adding missing information to records you already have, using external data sources, so the record becomes usable for a decision. You start with a thin record (an email, a domain, a LinkedIn URL) and finish with a full profile: name, title, company size, industry, phone, tech stack, funding. Done at scale, it is what separates a list of addresses from a list of accounts you can score, route, and sell to.
If you have a spreadsheet with 500 emails, and you want to find out the names, positions, and locations of each person on your list, how will you do it? Most often, you might start doing your research online, searching for data about each person in your list, and then manually typing it into the sheet line by line. This data entry task is basically the manual, unautomated version of data enrichment.
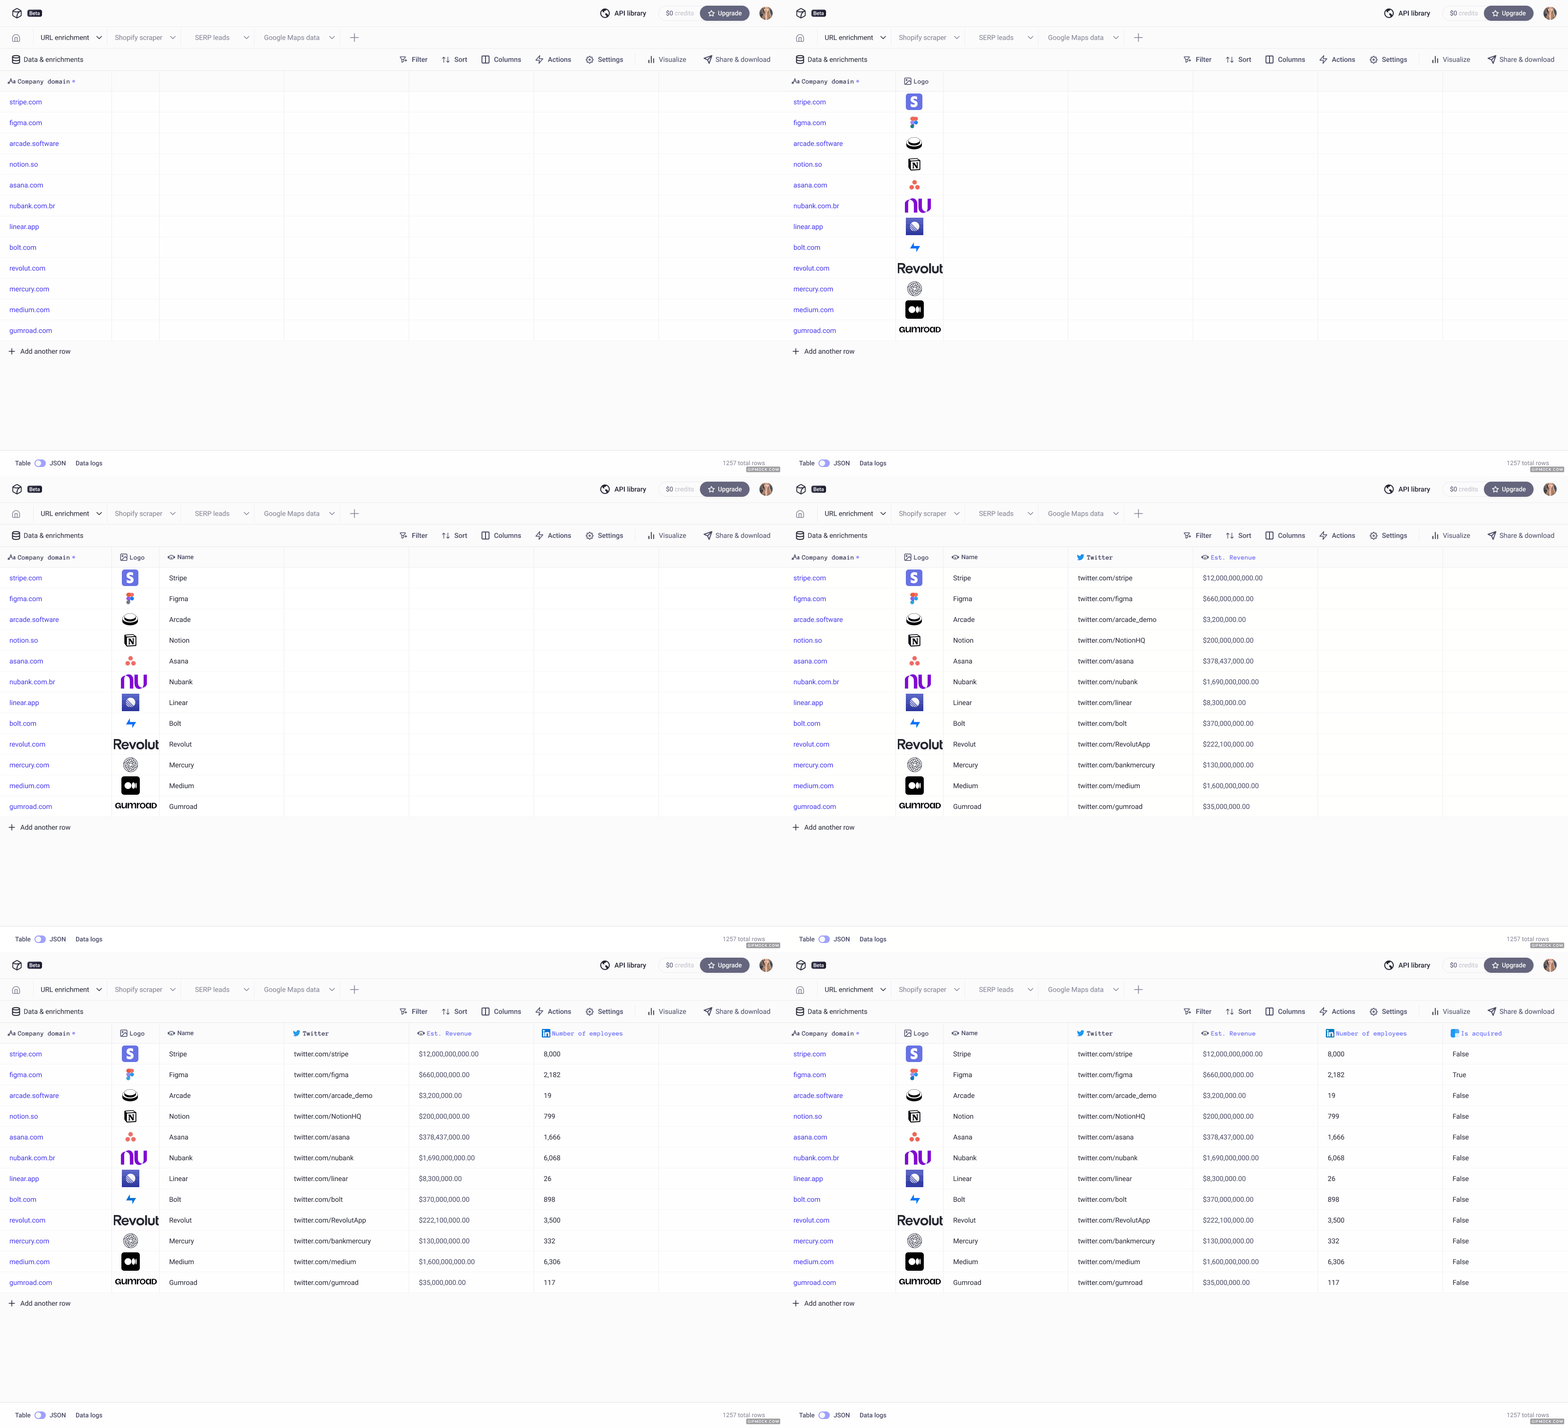
On Databar, enrichments let you automatically populate and create new columns in your spreadsheet using third-party data sources that already have the data that you need. Here's how it looks in real-time when enriching a list of URLs with logo images, names, Twitter handles, est. revenue & head-count data, and data on whether the company has been acquired:
In more formal terms, data enrichment is used to add additional information or context to existing data in order to make it more valuable and useful for analysis or decision-making. Its goal is to enhance the insights that can be gleaned from the data and make it more actionable.
The Six Types of Data Enrichment
"Data enrichment" is one word for six fairly different jobs. Each one has its own providers, its own match rates, and its own decay rate. Knowing which type you actually need saves both money and a lot of wasted setup.
Type | What it adds | Typical input | How fast it goes stale |
|---|---|---|---|
Firmographic | Employee count, revenue, industry, HQ, founding year | Company domain | Employee count shifts quarterly, industry rarely |
Contact | Name, job title, seniority, department, LinkedIn URL | Email or LinkedIn URL | Titles change with every promotion and job move |
Work email plus a deliverability verdict | Name + company, or LinkedIn URL | Fastest decaying field you own | |
Phone | Mobile and direct-dial numbers | LinkedIn URL | Slower than email, but coverage is thinner to begin with |
Technographic | CRM, analytics, infrastructure, and the rest of the stack | Company domain | Tools get swapped a few times a year |
Signals | Funding rounds, hiring, exec moves, news | Company domain or LinkedIn URL | Valuable for days, not months |
Most teams start with firmographic and email enrichment because those two feed scoring and outbound. The rest get layered on once the basics work. Each type has a deeper guide: company data enrichment for firmographics, technographic data for tech stack, phone number enrichment for direct dials, and buying signals for triggers.
Use Cases
Recruiting
Audience segmentation
By enriching data with demographic information, marketers can segment their audience and create more effective campaigns for each segment through APIs such as Nationalize.io.
Campaign optimization
Data enrichment can help marketers optimize their social media campaigns by providing insights into who engages with specific content through the Twitter API.
Financial Analysis
Set up custom live stock trackers to make the best-informed investments. Enriching portfolio data through APIs such as Financial Modeling Prep lets you build your own database of features & statistics to inform models and analysis.
Data is a powerful asset for any organization, and by using Databar.ai, companies can unlock the full potential of their data to drive growth and gain a competitive edge in their respective industries. With our powerful data enrichment tools at their fingertips, businesses can easily extract insights and make data-driven decisions to help them achieve their goals.
How Data Enrichment Actually Works: Single Source vs Waterfall
There are two ways to run an enrichment, and the difference decides your match rate.
Single source. You send the record to one provider and take whatever comes back. Simple, cheap per call, and capped by that provider's coverage. Every provider has holes: one is strong on US tech companies, another on European mid-market, a third on companies with a public-facing website and nothing else.
Waterfall. You define an ordered list of providers. The first one runs. If it returns nothing, the second runs on the same record. The chain stops the moment a provider returns a usable result. You get the union of everyone's coverage while paying mostly for the cheapest provider in the list.
Order decides the bill. If provider A costs 1 credit and covers 40% of your records, and provider B costs 3 credits and covers 70%, putting A first means you only pay the higher price on the 60% that A misses. Databar's waterfall setup lets you drag providers into the order you want and switch individual ones off. Our guide to how waterfall enrichment works covers ordering strategy in detail.
Waterfalls also fold in verification. On the email waterfalls, you can attach a verifier (Emailable, Bouncer, or ZeroBounce) so every address is checked for deliverability before it is accepted. If it fails, the waterfall moves to the next provider instead of handing you a bounce. One honest caveat: you are still charged for the provider that returned the address, because it did return a result. Verification can push up your credits per row, so budget for it.
Where Enrichment Data Comes From
Understanding sourcing tells you how much to trust a field.
Web crawls. Crawlers read a company's public pages, source code, DNS records, and HTTP headers. Reliable for anything customer-facing (CMS, analytics, chat widgets, payment processors) and blind to everything internal.
Job postings. A company hiring a "Snowflake data engineer" is telling you what its data stack looks like. This catches internal tools that crawls miss, at the cost of a lag between adoption and the first job ad.
Self-reported profiles. LinkedIn and similar networks. Good directional signal on headcount and industry. Employee counts skew high because people do not always update old roles.
Registries and filings. Company registers, SEC filings, funding disclosures. Verified but slow, and only covers entities that have to file something.
Aggregators. Providers that blend several of the above into one normalized API. Coverage is broader, and the tradeoff is that you inherit their reconciliation choices when two upstream sources disagree.
No single method wins. A record confirmed by two independent methods is worth far more than one confirmed by a single crawl, which is the practical argument for running more than one provider.
What Data Enrichment Costs in 2026
Enrichment pricing comes in three shapes, and picking the wrong one is how budgets get wrecked.
Per seat. You pay per human user, usually with an API allowance attached. Fine when people do the work. It does not flex when a script or an agent drives the volume.
Per row. You pay for every record you push through, hit or miss. Predictable for a one-off batch. Punishing for anything that retries.
Outcome-based. You pay only when data comes back. Empty lookups are free, and in a waterfall only the provider that actually returned data is charged. A partial record is charged.
Databar uses outcome-based billing on a credit plan. As of September 2026, Build is $99 per month with 5,000 credits and Scale is $495 per month with 50,000 credits, with Enterprise priced on request. Every new workspace gets a 14-day full-product trial with 100 credits. Every workspace starts with 100 free trial credits, and the 14-day trial opens the full product. Current numbers live on the pricing page.
Credit cost per call varies by provider, because each provider prices its own data. A company lookup can run 2 to 15 credits depending on who answers. In-table work like formulas, merge columns, and deduplication is free and never touches credits. If you are trying to size a number for a finance conversation, our data enrichment budget guide works through the math.
Data Enrichment Decays, So Plan the Refresh
Enrichment is not a one-time project. People change jobs, companies restructure domains, tools get swapped, headcounts move. A record enriched a year ago and never touched again is quietly wrong in several places.
A refresh schedule that works for most teams:
Every 90 days: verified emails and job titles, which move fastest.
Every 6 months: employee count and tech stack.
Annually: revenue estimates, industry classification, HQ location.
Never: founding year. It does not change.
Run conditions make this cheap to enforce. You can tell an enrichment to skip any row that already has a fresh value and only spend credits on the stale ones. Scheduled automations then pick up the queue without anyone remembering to press a button.
How to set up enrichments with Databar
Enrichments can be set up without code through Databar in a few clicks and without technical expertise! To get started, simply upload a CSV file, click Data & enrichments > Add new enrichment > select an enrichment > Install columns.
If you would rather work from code or from an AI agent, the same catalog is available four other ways. There is a REST API at https://api.databar.ai/v1 authenticated with an x-apikey header, a Python SDK (pip install databar), a CLI that ships with the same package, and a hosted MCP server at https://mcp.databar.ai/mcp that lets Claude and other agents run enrichments directly. The Python SDK quickstart is the fastest way in, and MCP vs SDK vs API covers which surface fits which job.
Five Data Enrichment Mistakes That Cost Real Money
Enriching everything before you qualify anything. Contact enrichment on a list you have not filtered by ICP burns credits on companies you will never sell to. Enrich the company first, cut the list, then find people at what survives.
Pull the same account from three providers and you can get 180 employees, 240, and "201 to 500". Nobody is wrong, and that is the trap: employee count is an estimate, not a fact. Every provider models it from different inputs, and self-reported profiles skew high because people leave old roles on them. An exact cutoff at 200 therefore puts that account inside your ICP or outside it depending on which provider answered first. Score on bands (1 to 50, 51 to 200, 201 to 500) and the disagreement stops moving accounts around.
Skipping normalization. "Software", "Computer Software", and "SaaS" are the same industry to a human and three different values to a scoring model. Standardize to one taxonomy before the data reaches your CRM.
Sending unverified emails. A provider returning an address is not the same as that address being deliverable. Attach a verifier or expect the bounce rate to show up in your sender reputation.
The last one is quieter than the others. A team enriches a list, pushes it to the CRM, and never touches it again. Twelve months on, a chunk of the titles are wrong, some of the emails bounce, and the lead scoring built on top of those fields is scoring fiction. Set the refresh cadence from the decay section in the same session you set up the enrichment.
Also interesting
FAQ
What is data enrichment in simple terms?
Data enrichment means filling in the blanks on records you already have by pulling the missing fields from external data sources. You give it an email, a domain, or a LinkedIn URL. It gives you back the name, title, company size, industry, phone, and whatever else you asked for.
What is the difference between data enrichment and data cleaning?
Data cleaning fixes what is already in the record: typos, duplicates, inconsistent formats, dead addresses. Data enrichment adds what was never there. Most teams need both, and cleaning usually comes first, because enriching a duplicate just gives you two enriched duplicates.
How accurate is data enrichment?
It depends on the field and the method. Web-detected technologies on a public site are close to certain. Revenue estimates for private companies are modeled and can differ by 30% to 50% between providers. Email addresses are only as good as the verification behind them. Treat single-source results as strong indicators, not facts, and cross-check the fields your decisions actually hinge on.
Do I need multiple enrichment providers?
For anything past a small list, yes. Single-source coverage caps out well below what the market can supply, and the gap is different for every provider. A waterfall across several providers is how teams reach an 85% match rate from one call without signing several contracts.
How much does data enrichment cost?
It depends on the pricing model and the providers you use. On Databar as of September 2026, Build is $99 per month for 5,000 credits and Scale is $495 per month for 50,000 credits, billed on outcomes so empty lookups cost nothing. Per-call credit costs vary by provider, typically a couple of credits for a basic company lookup and more for premium contact data.
How often should I re-enrich my data?
Emails and job titles every 90 days, employee count and tech stack every six months, revenue and industry annually. Use run conditions so the refresh only spends credits on rows that have actually gone stale.
Click here to get started today.
Would you like a custom enrichment set up for you? Get in touch with us!
Recent articles
See all