A pipeline number tells you how much opportunity value sits in the CRM. It doesn't tell you how much of it is real. Two teams can both report $4M in open pipeline for the quarter, and one might close a quarter of it while the other closes a tenth, because half its deals stopped moving weeks ago and nobody marked them lost.
Forecast confidence is low across the industry. In Gartner's 2020 State of Sales Operations survey, only 45% of sales leaders and sellers said they had high confidence in their organization's forecasting accuracy. Pipeline quality metrics are how RevOps closes that gap: they measure whether the deals in the pipeline are likely to close, not only how many there are.
This guide covers where pipeline quality usually breaks, the eight metrics worth tracking, how to adjust deal probabilities by quality instead of stage alone, and a weekly review you can run with your sales leaders.
Where pipeline quality breaks
Low-quality pipeline rarely comes from one bad decision. It builds up from habits that each look reasonable on their own.
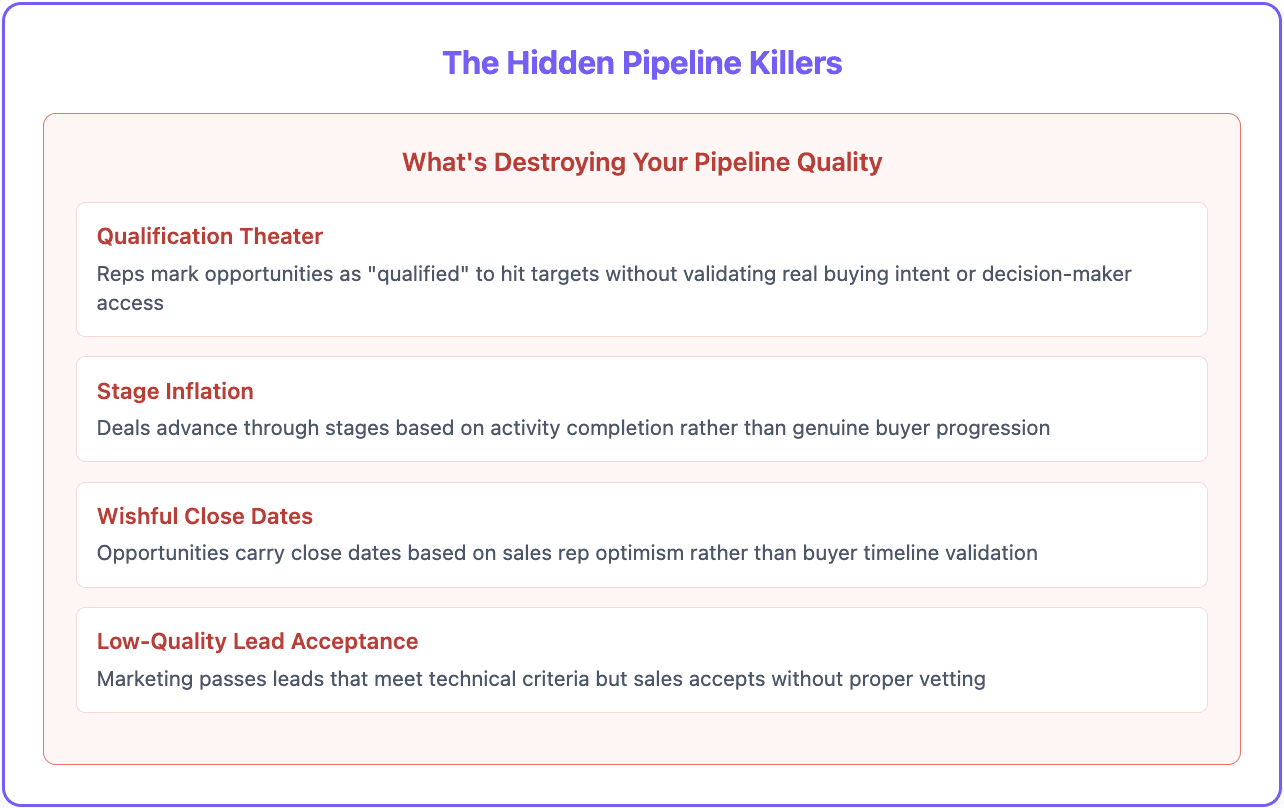
Qualification theater. Reps are measured on pipeline created, so opportunities get marked qualified before anyone has confirmed a real need, a budget, or access to the person who signs.
Stage inflation. Deals move forward because an activity happened (a demo was held), not because the buyer did something (agreed on evaluation criteria, brought in finance). The stage says "evaluation" while the buyer is still deciding whether to look at all.
Wishful close dates. The close date is the end of the quarter because that is when the rep needs it, not because the buyer said so. Those dates slip one month at a time.
Loose lead acceptance. Marketing hands over leads that meet the letter of the qualification criteria, and sales accepts them without checking fit. They sit in early stages, pad the numbers, and rarely convert.
Every metric below is designed to expose one or more of these.
Coverage is a volume metric, so treat it that way
Pipeline coverage (open pipeline for the period divided by quota) is the first number most teams look at, and it is useful. It is also the easiest one to game, because every one of the problems above makes coverage look better.
The right coverage target isn't a universal 3x. It comes from your own win rate. If historically about 25% of the pipeline value open at the start of a quarter closes within that quarter, you need roughly 4x coverage to hit the number. If 33% closes, you need about 3x. Work out your own ratio from the last four to six quarters before adopting anyone's benchmark.
Then change what counts. Coverage calculated only from opportunities that meet your stage exit criteria (a confirmed pain, an identified economic buyer, a buyer-stated timeline) is far more honest than coverage on everything open. The difference between the two numbers is itself a quality metric: if qualified coverage is 2x and total coverage is 4.5x, half the pipeline is hope.
The eight pipeline quality metrics
1. Stage-to-stage conversion rate
Of the deals that reach each stage, what share move to the next one, and what share eventually close? Conversion to closed-won should rise sharply as deals progress. If deals in proposal close at nearly the same rate as deals in discovery, your stages are labels, not checkpoints, and the exit criteria need rework.
2. Time in stage
Track the median days deals spend in each stage, split by segment, since enterprise and SMB deals move at very different speeds. A useful working rule: a deal that has spent more than twice the median time in its current stage needs a documented next step with a date, or it gets closed out. Reps rarely kill their own deals, so this rule usually has to come from RevOps.
3. Pipeline age distribution
Separate from time in stage, look at the total age of open deals compared with your typical sales cycle. Deals far older than a normal cycle inflate coverage without producing revenue. Plot how much pipeline value sits in each age bucket; a growing tail of old deals is an early sign the forecast is about to miss.
4. Close date slippage
Count how many times each deal's close date has moved, and by how much. A deal pushed once can be fine. A deal pushed three quarters in a row is telling you something. Most CRMs keep field history, so this is easy to report on, and it catches wishful close dates better than anything else.
5. Stakeholder breadth
How many people at the buying company are actively involved: attending meetings, replying to email, reviewing proposals? Deals that depend on a single champion are fragile, since one job change or reorg ends them. Track the number of engaged contacts per opportunity and whether that list includes someone with budget authority.
6. Stage distribution
Look at what share of pipeline value sits in early, middle, and late stages. There's no correct split for every business, but the trend matters. Thin late-stage pipeline means this quarter is at risk. Thin early-stage pipeline means next quarter is. A sudden bulge in late stage right before quarter end often means deals were pushed forward to look good in the forecast call.
7. Source to closed-won
Attribute closed-won revenue, not just pipeline created, back to its source: outbound, inbound, partners, referrals, expansion. Channels that produce a lot of pipeline and little revenue are either reaching the wrong accounts or losing deals at handoff. This is also the fairest way to measure marketing: conversion to revenue, not MQL volume.
8. Data completeness
What percentage of open opportunities have every critical field filled in and current: amount, close date, stage, next step, economic buyer, and valid contact details for the people involved? Every other metric on this list is calculated from those fields. If a third of deals have no next step and some contacts have left the company, the reports built on them are guesses. Gartner's same survey found only 47% of respondents believed their organization had high-quality data, so this is rarely a solved problem. Our post on how bad CRM data breaks revenue forecasts goes deeper on this one.
Adjust probability by quality, not stage alone
Most CRMs assign a fixed probability to each stage, something like 20% for discovery, 50% for proposal, and 75% for negotiation. Every deal in a stage is treated the same, which is exactly the assumption the metrics above prove wrong.
A quality-adjusted forecast starts from the stage probability and moves it up or down based on evidence:
Qualification completeness. Identified stakeholders, confirmed budget, and a documented pain raise probability. Missing elements lower it.
Engagement. Several responsive stakeholders raise it. A single contact who has gone quiet lowers it.
Timeline validation. A close date the buyer confirmed, tied to a real event (contract renewal, budget cycle, launch date), holds its probability. A date the rep picked, or one that has slipped repeatedly, loses some.
Competitive position. Knowing who else is being evaluated, and where you stand, lets you adjust instead of guess.
Here is how that could look for three deals that all sit in the proposal stage. The adjustments are illustrative; calibrate your own against past deal outcomes.
Deal | Evidence | Stage default | Adjusted |
|---|---|---|---|
A | Economic buyer on calls, budget confirmed, buyer-stated go-live date, 4 engaged contacts | 50% | 65% |
B | Champion engaged, budget "expected", close date moved once | 50% | 40% |
C | One contact, no reply in 3 weeks, close date moved three times | 50% | 15% |
The stage-based forecast counts all three at 50%. The adjusted one shows the real exposure: deal C is barely pipeline, and it would be better to say so now than in the last week of the quarter.
Start simple. A scorecard with four or five yes/no checks per deal, each worth a fixed adjustment, is enough to begin with. Once you have a few quarters of outcomes, check which checks actually predicted wins and reweight.
The weekly pipeline quality review
Metrics only help if someone acts on them. A 30 to 45 minute weekly review between RevOps and sales leadership is where that happens. A workable agenda:
Qualified coverage. Compare total coverage with coverage from deals that meet exit criteria. If qualified coverage is below what your win rate requires, agree on the prospecting plan for the week.
Movement. Which deals advanced, and what did the buyer do to earn it? Which deals didn't move at all?
Stale deals. Anything past twice the median time in stage gets a dated next step within 48 hours or gets closed out.
Slipped dates. Review every close date that moved this week and why.
Data gaps. List open deals missing a next step, an economic buyer, or valid contact details, and assign owners.
Forecast. Call commit, best case, and upside from the quality-adjusted view, not from stage alone.
Keep a running log of what was committed each week against what closed. After a couple of quarters, that log is the best evidence you will have of whether the process is improving forecast accuracy.
How enrichment supports pipeline quality
Several of these metrics depend on data reps don't keep current on their own. Contacts change jobs, and a deal whose champion left three weeks ago still looks healthy in the CRM. Account context goes stale too: a new funding round, a leadership change, or a hiring freeze can all change a deal's odds.
Re-enriching the contacts and accounts on open opportunities on a schedule catches those changes before the forecast call does. With Databar you can pull your open deals from HubSpot or Salesforce into a table, refresh contact and company data from 160+ providers (using waterfalls so a contact one source can't find gets checked against the next), compare each contact's current employer with the CRM to spot job changes, and sync the results back to the CRM on a scheduled run. Paid plans start at $99/month, and there is a 14-day trial if you want to test it on your current pipeline.
If your scoring upstream is part of the problem, our guide to lead scoring and account segmentation covers how to keep low-fit leads from becoming opportunities in the first place.
FAQ
What is the most important pipeline quality metric?
If you can only add one, track close date slippage alongside time in stage. Together they surface most of the deals that are inflating your pipeline. Coverage matters too, but on its own it measures quantity, and it gets better when quality gets worse.
What is a good pipeline coverage ratio?
It depends on your win rate. Divide 1 by the share of starting pipeline value you typically close within the period: if you close 25%, you need about 4x. The common 3x rule of thumb assumes roughly a one-in-three close rate, which many teams don't have.
How often should we review pipeline quality?
Weekly for deal-level hygiene (stale deals, slipped dates, missing fields). Monthly for trends such as source to closed-won and average deal size. Quarterly to recalibrate stage exit criteria and probability adjustments against actual outcomes.
How do I know if my stage definitions work?
Check historical win rates by the furthest stage a deal reached. Win rates should climb clearly at each stage. If two stages close at similar rates, the exit criteria between them aren't separating real buying progress from activity.
Recent articles
See all